
Getting Started With EZL
EZL is a scientific graphing and data plotting application, built to simplify your workload. Our primary goal was to ease the task of routine data plotting and analysis. Loading data into EZL is as simple as dragging–and–dropping or double–clicking your data file. The most commonly used functions are at the front of the interface while the more advanced capabilities, such as live data streaming, take just a few mouse clicks. The main interface, shown below, has 6 primary components:
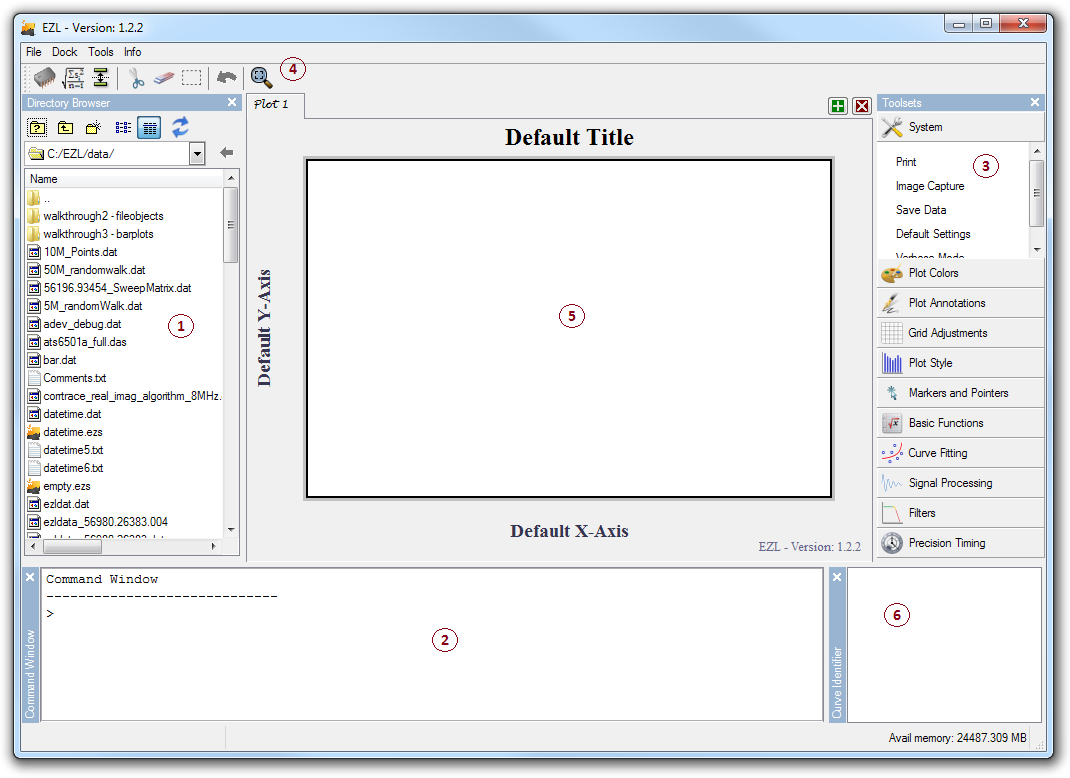
- The Directory Browser is used to provide a quick and easy way to find and import data files. Use the browser to navigate through your computer to find your data files or scripts. Then simply double–click a file or drag one or more files from the browser onto the Plotter (5) to prompt EZL to plot your data.
- The Command Window is used to provide warnings, errors, or information from EZL, or to issue commands to EZL such as to enable markers, show statistics, or remove data. To see a complete list of available commands, type "help" in the command window. To see help on a specific command, type "help <command>", where <command> is replaced by the name of the command. Example: "help smooth". To get information on help syntax formatting, type "help help".
- ToolsetsThe Toolsets provide a categorized view of the functions available to EZL. Nearly all of the functions contained within the toolsets have accompanying commands which can be issued through the command window.
- The buttons on the toolbar provide access to important commonly–used tasks.
-
The central object, the Plotter, provides access to the data plots. Plots are stacked inside the Plotter, with
each plot raised by clicking a tab on the tab bar, found on the top of the Plotter. When EZL first opens (as
shown above) only a single tab exists, labeled "Plot 1". Tabs can be relabeled by right–clicking
on the appropriate tab label. New tabs can be created, and old tabs removed, by clicking the
 and
and  buttons on the top–right of the Plotter, respectively.
- The Curve Identifier Panel is useful when multiple curves are plotted within the same plotter. The panel provides a list of each plotted curve, along with each curve's unique ID and associated color.
Getting Up And Running... Quick!
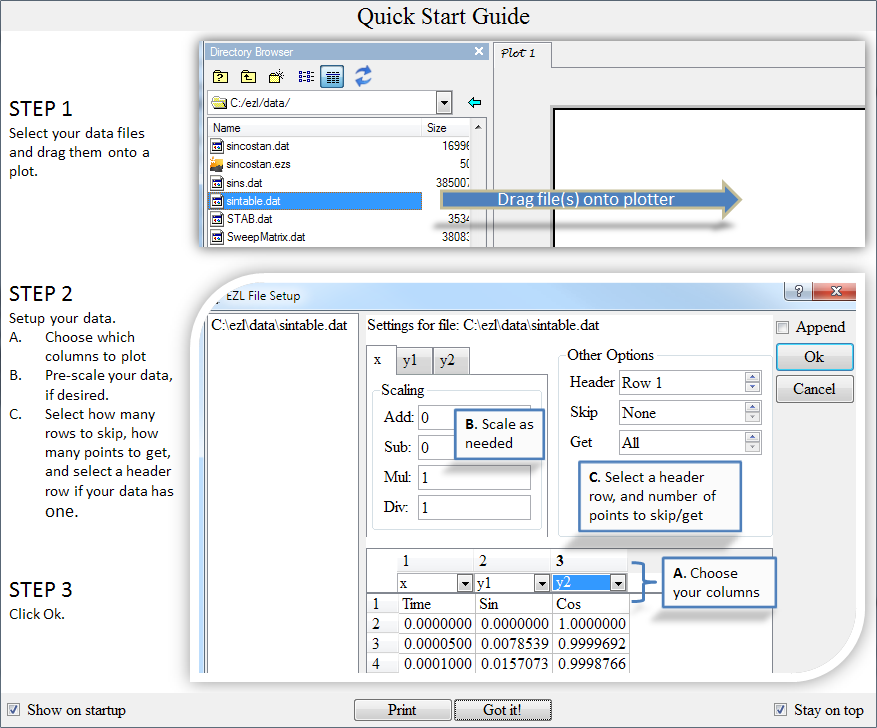
The simplest way to get your data onto into a graph is by drag-and-drop. Jump here to see how!
When EZL is run for the first time, a Quick Start Guide1 is displayed.
1
Uncheck Show on startup, to disable the guide on subsequent runs. It can always be re-enabled from
Toolsets→Default Settings→System Settings→
Quickstart Guide. Choose Hide or Show then click Apply & Save; the setting will apply the next
time you run EZL.
As shown, the most basic way to plot a file is to simply drag the file onto an empty Plotter. Files can be dragged either from the Directory Browser or directly from your Windows filesystem or desktop. You can drag a single file, or many. EZL will then display a File Setup Dialog, designed to ease the data import process. Typically, just a few clicks are needed.