Data Plotting
Plot large data sets accurately and customize your plots easily.Data plotting with EZL is easy, accurate, and powerful. Plot large data sets and customize your plots for publication quality visuals.
Accurate and precise data plotting leads to more confident decision making. Better decisions result in greater operational efficiency, cost reduction, and reduced risk.
With just a few mouse clicks, you can modify labels, zoom in/out, trim outliers, and crop data. Plotters can have custom annotations, such as arrows and text boxes, and vertical, horizontal, and delta data markers.
Plotting software that makes data visualization easy
Plot creation starts with EZL’s intuitive interface. Take advantage of ribbon collections of common properties, tabbed selection of plotters, left mouse button plotter customization
Compare and contrast trends in your data by creating multiple plots. There is no limit to the number of plotters you can have open. It is often useful to work on multiple data sets, spanning multiple plotters, at once.
Easily import data with EZL’s drag and drop feature. Importing data into plotters is as simple as dragging data files (from your Windows system or from the Directory Browser) onto the plotters or through the “ezl” command, as discussed in the Plotting Basics section.
EZL Toolsets covering a wide range of data analysis needs make in-depth analysis fast and easy.
Go beyond Excel – Plot and analyze large data sets
EZL’s data plotting algorithms allow you to plot and analyze millions of data sets quickly and easily. EZL is a great alternative to commonly used data plotting software tools such as Microsoft® Excel.
Microsoft® Excel analyzes limited data points, speed is deplorable, and costs can be excessive with minimal features.
While the exact number of points you will be able to plot with EZL depends on your system’s specifications, EZL has been tested with data files in excess of 100 million data points.
Customize every detail of your plots and graphs
EZL offers the flexibility to customize every detail of your graph. EZL plots can easily be annotated uses labels and arrows. Aside from the four major plot labels (title, x-axis, y-axis, and footnote), custom labels and arrows are available from the Plot Annotations toolset.
You can add custom labels of your plots and easily change plotter tab names. Change fonts types, size, and colors of your labels, markers, and graphs. Create custom data markers including vertical, horizontal, and delta markers.
Use the Arrow Table tool to create custom arrows for your charts and graphs.
Utilize multiple plotters at once
There is no limit to the number of plotters you can have open. EZL makes it easy to work on multiple data sets, spanning multiple plotters, at once, without losing track of your plotter.
The Curve Identifier Panel is useful when multiple curves are plotted within the same plotter. The panel provides a list of each plotted curve, along with each curve’s unique ID and associated color.
Often, when working with multiple curves, one or more curves may be obscured or difficult to see when its data are plotted beneath other curves. The Curve Identifier Panel can assist in such cases by highlighting a curve of interest.
EZL Features
EZL’s data plotting and graphing tool contains the key features you need to accurately and easily display your data. Features include:
- Zoom in/out without data loss
- Label Plots – Change your plot title, x-axis, y-axis, and footnote
- Data Markers – Data markers allow you to quickly mark or measure certain values within your data sets. They can be set to exact locations, or manually placed by dragging them with the mouse. Plotters can have horizontal, vertical, and/or delta (difference) markers.
- Move/Copy Curves – Curves within a plotter can be moved/copied to new or existing tabs.
- Tab Names – Create custom tab names to intuitively toggle between multiple plotters
- Curve Identifier Panel – When working with multiple curves, one or more curves may be obscured or difficult to see when its data are plotted beneath other curves. The Curve Identifier Panel can assist in such cases by highlighting a curve of interest.
- Plotting Toolbar – The EZL Toolbar buttons provide access to important commonly-used tasks including:
- Cache
- Statistics
- Trim Outliers
- Crop Tool
- Eraser Tool
- Selection Tool
- Undo
- Snap-To
- Rescale
- Zoom in/out
- Abort
Data Plotting Software Settings
Adjust your data plotter settings via the Default Settings page. Adjusting default settings can help you save you time and provide a customized experience. Adjustable plotting/graphing settings include:
Export Plot/Graph Images for Publication
You may export images for publication quality presentations. Image formats include JPG, PING, GIF, and BMP formats for presentations. EZL’s Image Capture also allows you to set defaults.
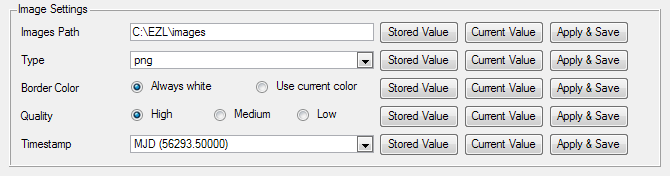
| Images Path | Your default images path is the path to which all images will be automatically saved when you click the Image Capture button in the Systemtoolset. |
| Type | This is the image type which will automatically be generated when you click the Image Capture button in the System toolset. Type “png” typically produces the best quality-to-size tradeoff. |
| Border Color | It is often desirable to always use white borders for your image captures. This is particularly true when you plan to embed your images in presentations or reports where your canvas backgrounds are white. The Border Color control setting can be used for this purpose. |
| Quality | Set the quality, and consequently file-size, of the image captures. |
| Timestamp | Image captures are automatically given timestamps within their filenames. This control setting allows you to specify how to format the timestamps. |
Support Documentation
Data Plotting Image

Get a Free 30-Day Demo Now
No Credit Card Required. No Registration.