
Annotations
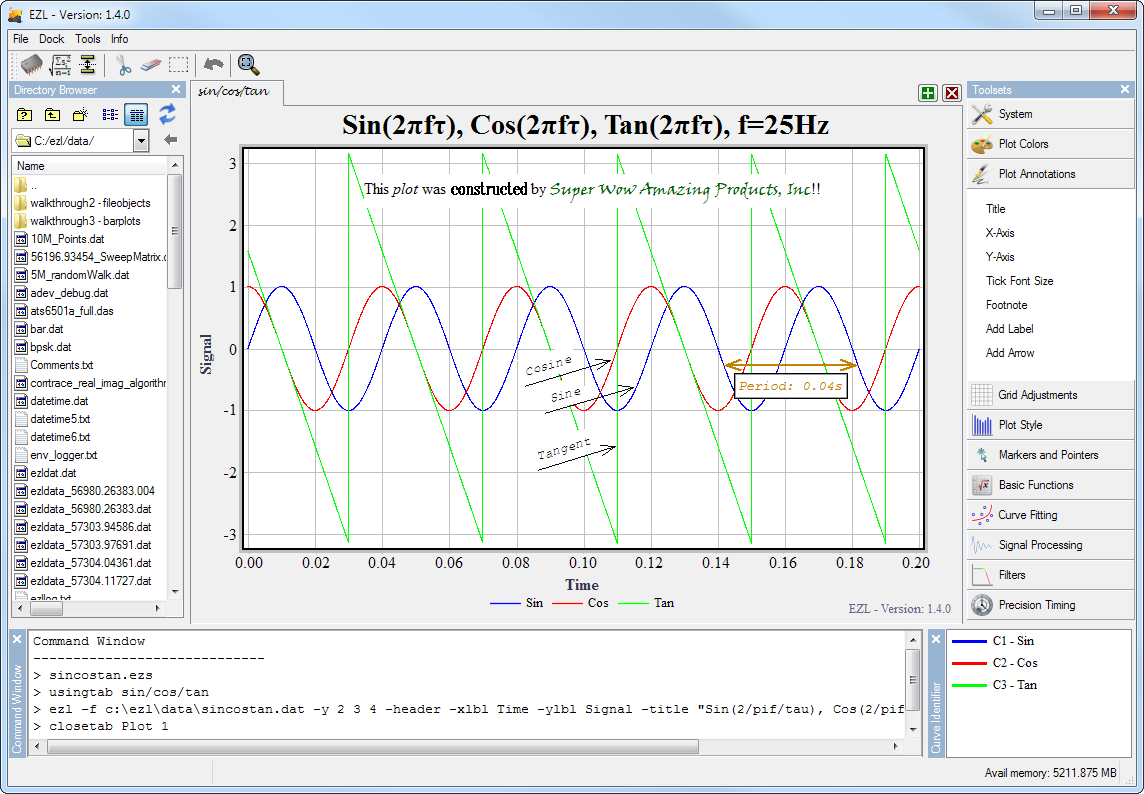
EZL plots can easily be annotated uses labels and arrows. Aside from the four major plot labels (title, x-axis, y-axis, and footnote), custom labels and arrows are available from the Plot Annotations toolset.
The Four Major Labels
The fastest way to change the four major plot labels (title, x-axis, y-axis, and footnote) is via the Command Window. The commands are as follows (using the plot above as an example):
> title Sin(2/pif/tau), Cos(2/pif/tau), Tan(2/pif/tau), f=25Hz
> xlbl Time
> ylbl Signal
> footnote EZL - Version: 1.4.0
As shown, you simply type "title", "xlbl", "ylbl", or "footnote" and then the text you would like to apply.
You can also use special symbols within your text. For instance, in the title command above
we used /pi to include the  symbol and /tau to include the
 symbol.
For a list of available symbols type "help /" in the Command Window.
For greater control, you can open a Label Editor by left-clicking (once) on any of the labels, or by clicking one of the items in the Annotations toolset.
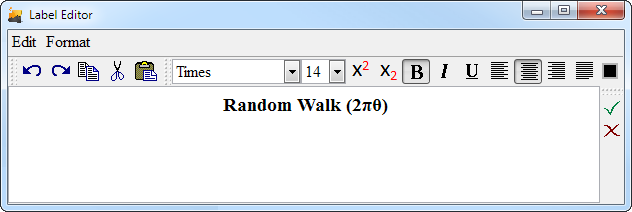
Here you can create and style multi-line labels. To apply the new label, click the green checkmark - or use the keyboard shortcut Ctrl+Enter.
Custom Labels
To add custom labels to a plotter, select Add Label from the Plot Annotations toolset. Doing so will open a Labeler tool which you can use to create, edit, and delete labels. All of the custom labels on the plot will be contained here.
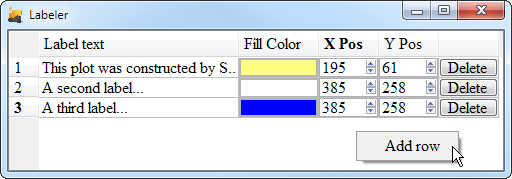
The options for each custom label in the Labeler are contained in rows. Each row has the following 5 cells:
- Label text - Click this cell to open the Label Editor for creating the text of the label. The Label Editor is also used to set the font-style, font-size, alignment, color, etc...
- Fill Color - Click this cell to set the background color for the label.
- X Pos - Use this cell to control precise horizontal positioning on the label on the plotter.
- Y Pos - Use this cell to control precise vertical positioning on the label on the plotter.
- Delete - Click this cell to delete the label.
To create new labels, right-click anywhere within the empty area of the Labeler, and select "Add row". Labels are immediately generated, and changes made within the Labeler are immediately reflected on the plot. When you're done making changes, simply click the X on the top-right corner to close the Labeler.
Moving Labels
To move a label about the plot, simply click-and-drag. Precise positions can be set by re-opening the Labeler via Toolsets→Add Label and using the X Pos and Y Pos cells.
Editing Labels
A label's text, font, and style can be edited by left-clicking on the label. Clicking on a label will automatically open it's corresponding Label Editor. To create new labels, see above.
Resizing Labels
When you create a new label, EZL attempts to size the resulting label to a suitable shape. Sometimes, however, you may want your text to wrap a certain way, or you may want to the label's background color to yield a larger footprint. To manually resize a label within a plotter, double-click the label. Doing so will present temporary handles which you can use to manually resize the label. When done, simply click off of the label to remove the handles.
Arrows
To add arrows to a plotter, select Add Arrow from the Plot Annotations toolset and an arrow will be immediately created and placed on the plotter.
Customizing Arrows
To customize an arrow, move the mouse pointer to the arrow until the arrow's handle appears. Then right-click the handle and select "Customize". The Arrow Table will then open.
![]()
Each arrow which exists on the plotter will be available from the Arrow Table tool. Here arrows can be customized with the following attributes:
- Text - Text may be added to an arrow by typing here.
- Text Rotation - When checked, the angle of the rendered text will mimic that of the arrow.
- Text Frame - When checked, a frame will be drawn around the arrow's text.
- Line Width - Use this to increase the thickness of the arrow.
- Color - Double-click the color box to set the arrow's (and its text) color.
- Font Size - Use this to change the arrow's text font size.
- X Head - Provides precise control of the horizontal position of the arrow's head.
- Y Head - Provides precise control of the vertical position of the arrow's head.
- X Tail - Provides precise control of the horizontal position of the arrow's tail.
- Y Tail - Provides precise control of the vertical position of the arrow's tail.
- Arrow Head - Check this box to display the arrow's head.
- Arrow Tail - Check this box to display the arrow's tail.
- Delete - Delete the arrow.
Editing Arrows
To edit an arrow, move the mouse pointer to the arrow until the arrow's handle appears. Then right-click the handle and select "Customize". The Arrow Table will then reopen.
Moving Arrows
To move an arrow, move the mouse pointer to the center of the arrow until the arrow's handle appears. Then grab the handle with the left mouse button and drag the arrow to the new location. The arrow's precise position may be customized via the Arrow Table.
An arrow's text will follow the arrow while moving the arrow. However, the text itself may be independently moved by grabbing the text and dragging it to the desired location.
Rotating Arrows
To rotate an arrow, move the mouse pointer to the head or tail of the arrow until the arrow's handle appears. Then grab the handle with the left mouse button and drag the arrow end to the new location. The arrow ends' precise positions may be customized via the Arrow Table.
Note, it is common to require repositioning of an arrow's text after rotating.