
Plotter
EZL Plotters, while powerful, are designed to be very easy to use. With just a few mouse clicks, you can modify labels, zoom in/out, trim outliers, and crop data. Plotters can have custom annotations, such as arrows and text boxes, and vertical, horizontal, and delta data markers.
There is no limit to the number of plotters you can have open, and it is often useful to work on multiple data sets, spanning multiple plotters, at once. A single empty default plotter is create at startup and is given the name "Plot 1".
New plotters can be created by clicking the  button on the top-right side of the plotter tabs, and old (unwanted) plotters can be closed by clicking the
 button.
Importing data into plotters is as simple as dragging data files (from your Windows system or from the Directory Browser) onto the plotters or through the "ezl" command, as discussed in the Plotting Basics section.
Zooming
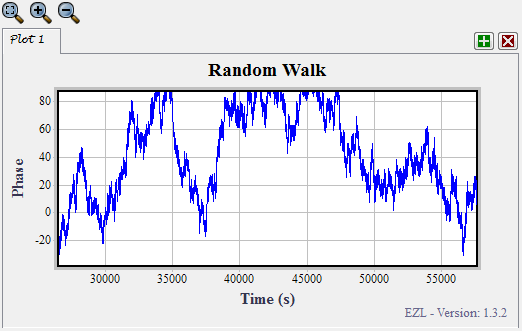
Once a file has been imported, you can zoom-in on the data by simply clicking within the plotter and dragging a box (rubber band) around the portion of the data you wish to view more closely. For example, see the two images below.
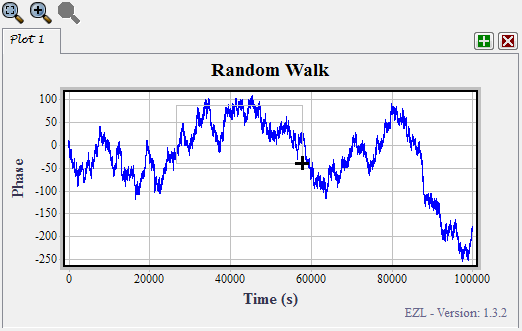
Notice in the top image that while drawing the rubber band the cursor changes to
 to indicate that this is a zoom operation. If the cursor changes to
  ,
,
 , or
, or  instead, you are in
Crop, Erase, or Select mode respectively. These later modes can be toggled on/off via the Toolbar.
instead, you are in
Crop, Erase, or Select mode respectively. These later modes can be toggled on/off via the Toolbar.
In zoom mode, which is on by default when the other three modes are off, no data is lost during the zoom operation.
You can zoom in farther by drawing subsequent rubber bands, or zoom out by using the
![]() toolbar button. Additionally, you
can shift the zoom area left, right, up, and down, using the arrow keys on your keyboard. Note, if the arrow keys
do not appear to be working, the likely cause is that the plotter does not have the keyboard
focus - give it the focus by simply clicking once somewhere within the plot, and try the arrow keys again.
toolbar button. Additionally, you
can shift the zoom area left, right, up, and down, using the arrow keys on your keyboard. Note, if the arrow keys
do not appear to be working, the likely cause is that the plotter does not have the keyboard
focus - give it the focus by simply clicking once somewhere within the plot, and try the arrow keys again.
Labeling
The fastest way to change the four major plot labels (title, x-axis, y-axis, and footnote) is via the Command Window. The commands are as follows:
> title Random Walk
> xlbl Time (s)
> ylbl Phase
> footnote EZL - Version: 1.3.2
As shown, you simply type "title", "xlbl", "ylbl", or "footnote" and then the text you would like to apply.
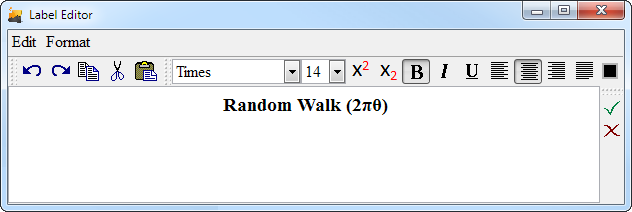
You can also use special symbols within your text. For instance,
> title Random Walk (2/pi/theta)
will display the title as
 .
.
For a list of available symbols type "help /" in the Command Window.
For greater control, you can open a Label Editor by left-clicking (once) on any of the labels.
Here you can create and style multi-line labels. To apply the new label, click the green checkmark - or use the keyboard shortcut Ctrl+Enter.
Data Markers
Data markers are very useful components of the plotters. These allow you to quickly mark or measure certain values within your data sets. They can be set to exact locations, or manually placed by dragging them with the mouse. Plotters can have horizontal, vertical, and/or delta (difference) markers.
Markers can be added to plotters through the Markers and Pointers toolset, or via the marker, hmarker, or dmarker commands.
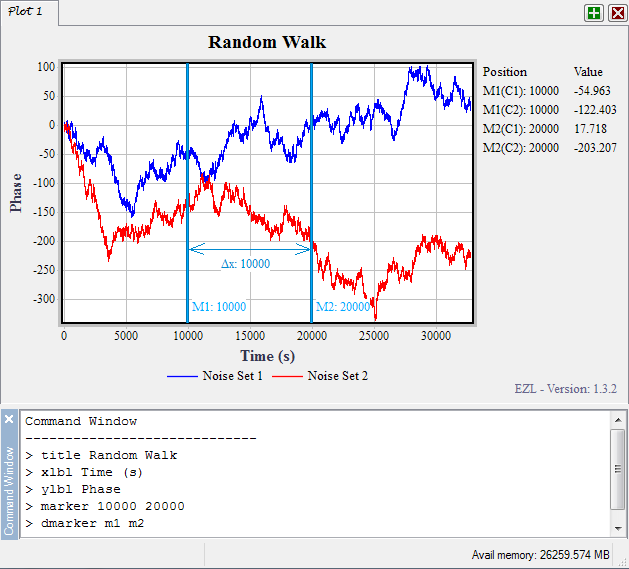
In the image above, two vertical markers were added to the plot at locations 10000 and 20000 using the marker command. Use this command (also synonymous with vmarker) to add any number of vertical markers. Similarly, use the hmarker command to add any number of horizontal markers. Use the dmarker command to add delta markers. Any marker may be dragged about the plotter by positioning your mouse over the marker, then grabbing and dragging.
Right-clicking on a marker will display a menu with choices relevant to the marker type:
Vertical Markers
When one or more vertical markers are added to the plotter, a marker table will be displayed to the right of the plotter (as shown in the plotter image above). The marker tables tracks the positions of all vertical markers, and the values where the markers cross each curve in the plotter. The marker table can be formatted, moved, and/or closed by right-clicking on the table. The table can be embedded within the plotter (which often makes for prettier image captures) by right-clicking the table, and choosing "Float". Drag the table to the desired position within the plotter, then right-click again and choose "Embed here". Right-click on the vertical marker for its operations menu. The menu contains the following items:
- Show Position
When checked (default) the position of the marker will be displayed to the right of the marker ID tag. For example, in the image above, the ID tags are M1 and M2, and they display the marker positions 10000 and 20000 because we had the Show Position item checked. The marker tags can be manually dragged and repositioned - useful whenever the tag text obscures your data. - Set Position
This menu item brings up an entry box, allowing you to specify a new exact position for the marker. - Move to mean
Click this item to have the marker automatically move itself to a curve's x-axis mean position. If the plotter contains more than one curve, you will be asked which curve to use. You may also choose to use All Curves for the mean calculation, and the marker will then move to the value representing the mean value of the x-coordinates of all the data on the plotter. - Move to median
Click this item to have the marker automatically move itself to a curve's x-axis median position. If the plotter contains more than one curve, you will be asked which curve to use. You may also choose to use All Curves for the median calculation, and the marker will then move to the value representing the median value of the x-coordinates of all the data on the plotter. - Find peak
Click this item to have the marker automatically position itself to cross the peak value of the curve. As before, if the plotter contains more than one curve, you can specify a single curve to use, or to include all curves in the search. - Find min
Similar to find peak, click this item to have the marker automatically position itself to cross the minimum value of the curve. If the plotter contains more than one curve, you can specify a single curve to use, or to include all curves in the search. - Find value
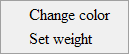
This item automatically searches for the point where a curve crosses a given horizontal value. Generally, a curve may cross back and forth across a horizontal many times. The search, therefore, will result in the crossing which is closest to the current position of the marker. As an example, from the image above, curve C1 (the blue curve) crosses through 0 many times. If we right-click on the first marker (M1), select Find value, and enter "0", the marker will move to approximately 13500, since this is the point where the curve crosses 0 which is closest to the marker's current position. If we were interested in an alterate 0-crossing, we would simply click and drag the M1 marker to the approximate correct location, and then use the Find value menu option again. - Change color
Allows you to change the marker's color. - Set weight
Allows you to change the marker's weight, or thickness.
Horizontal Markers
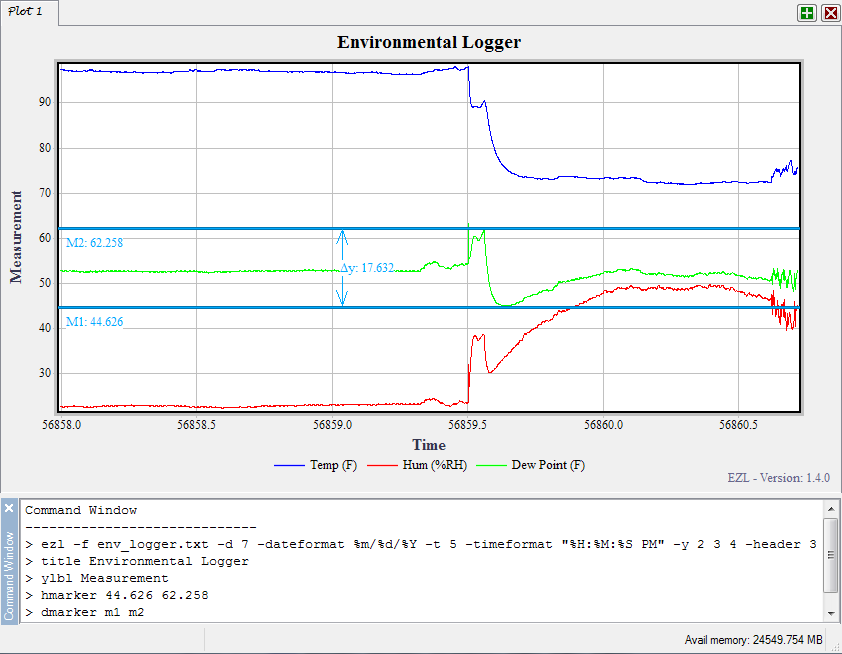
The horizontal marker menu contains the following items:
- Show Position
When checked (default) the position of the marker will be displayed to the right of the marker ID tag. For example, in the image above, the ID tags are M1 and M2, and they display the marker positions 44.626 and 62.258 because we had the Show Position item checked. - Set Position
This menu item brings up an entry box, allowing you to specify a new exact position for the marker. - Move to mean
Click this item to have the marker automatically move itself to a curve's mean value. If the plotter contains more than one curve, you will be asked which curve to use. You may also choose to use All Curves for the mean calculation, and the marker will then move to the value representing the mean of all the data on the plotter. - Move to median
Click this item to have the marker automatically move itself to a curve's median value. If the plotter contains more than one curve, you will be asked which curve to use. You may also choose to use All Curves for the median calculation, and the marker will then move to the value representing the median of all the data on the plotter. - Find peak
Click this item to have the marker automatically position to the peak, or maximum, of the curve. As before, if the plotter contains more than one curve, you can specify a single curve to use, or to include all curves in the search. - Find min
Similar to find peak, click this item to have the marker automatically position itself to the minimum value of the curve. If the plotter contains more than one curve, you can specify a single curve to use, or to include all curves in the search. - Find rms
Similar to the above, click this item to have the marker automatically position itself to the root-mean-squared (RMS) value of the curve. If the plotter contains more than one curve, you can specify a single curve to use, or to include all curves in the calculation. - Change color
Allows you to change the marker's color. - Set weight
Allows you to change the marker's weight, or thickness.
Delta Markers
Delta markers track the distance between two other markers (of similar orientation). For example, given two horizontal markers, M1 and M2, a delta marker can be added between them with the command "dmarker m1 m2". As one of the horizontal markers is moved (whether it is dragged or repositioned through a menu operation), the delta marker will automatically update to track the distance between M1 and M2. The delta marker menu contains the following items:
- Change color
Allows you to change the marker's color. - Set weight
Allows you to change the marker's weight, or thickness.
Move/Copy Curves
Curves within a plotter can be moved/copied to new or existing tabs. If the destination tab does not exist, a new tab will be created automatically. If the destination tab already exists, you can choose to send the curves to a new frame within the tab. Tabs may have up to four frames.
To move or copy curves, right-click within the plotter and select "Move/copy curve...". Doing so will open the Move/Copy query window.
- Select the curve(s) you wish to move or copy by clicking on the curve(s) in the "Choose curve(s)" box on the left. Hold down the Ctrl key on your keyboard while clicking to select multiple curves. The All Curves item may be selected to operate on all the curves in the plotter.
- Choose a destination tab.
- Choose a destination frame. When sending the curve(s) to a new destination tab, Center (New) will be the only available destination frame option. When sending the curve(s) to an existing tab, the destination frames which are available will depend on how many frames already exist in the destination tab.
- Finally, choose the operation you wish to conduct, and click Ok.
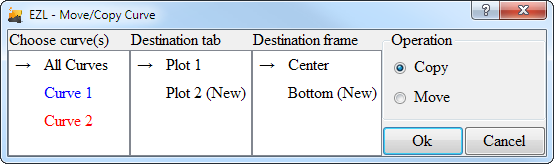
We use the following plot as an example.

Here we have plotted a BPSK signal (blue curve) along with its modulation code (red curve). We now wish to move the signal to a new frame, in order to provide a better view. We right-click on the plotter, select "Move/copy curve...", and set up the query window with the following options.
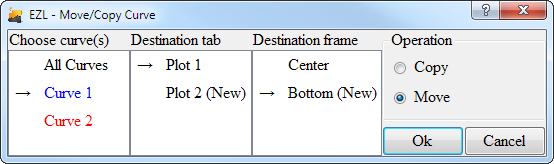
Clicking Ok yields the following plot.
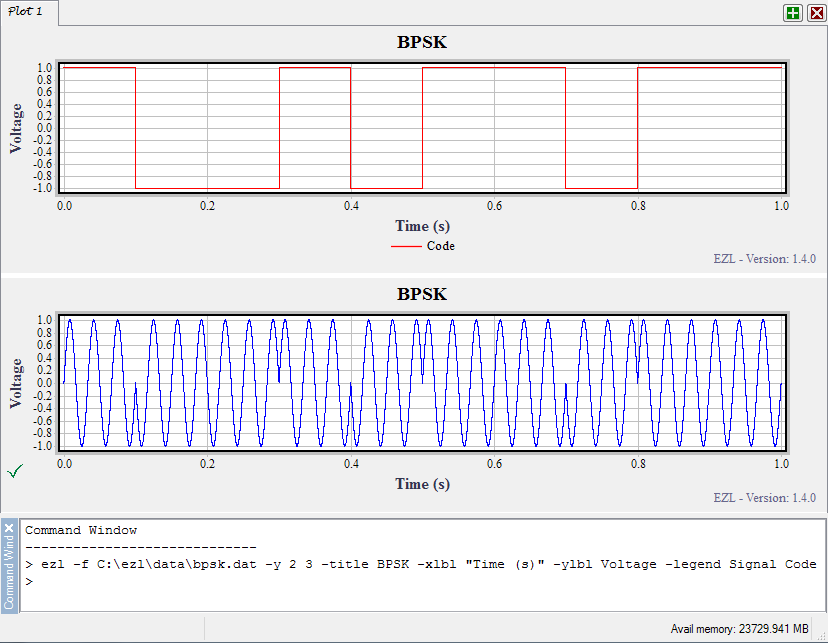
As shown, the signal (curve 1) has been moved to the bottom frame. Notice that "Signal" has been removed from the legend in the top frame, because the curve no longer exists. There is no legend on the bottom frame because, by default, EZL does not create legends for plots containing only a single curve.
The green checkmark on the left side of the bottom frame is used to indicate which frame is currently active. Issuing any commands, whether via the command window, the toolbar, or a toolset, will operate on the plotter in the active frame. To change the active frame, simply click once anywhere within the frame of interest. The checkmark will then move to the target frame.
The frame sizes can be manually adjusted by grabbing the divider (the bar between the two frames) with your mouse, and dragging up and down - or left and right, in the case where four frames are displayed.
Tab Names
Plotters are identified by their unique tab names. By default, tabs are named in sequence beginning with "Plot 1", then "Plot 2", "Plot 3", and so on. You can change the name of an existing plotter by right-clicking on its tab. You can also create new named plotters via the commands "newtab [tab_label]" and/or "using [tab_label]". These commands become most useful when scripting with EZScripts.