
Plotting Basics
There are many ways to get your data onto a plot. EZL is specifically designed to make the process quick and convenient. While all methods are equal in speed computationally, typically the fastest and most efficient way from the user's perspective is via the Command Window, using the "ezl" command. We typically advise beginners to first learn to plot via "ezl" command, and then later use the graphical File Setup interface when it's convenient. Spending a little time up front to become comfortable with EZL commands goes a long way to improving your efficiency.
Jump to: Using the File Setup Dialog
The EZL Command
The "ezl" command is used to load and plot data files. The file(s) to import, data preprocessing, and plot configurations can all be passed to the "ezl" command via input options. Options begin with a minus sign and are followed by an argument which (may) contain one or more fields.
Syntax: ezl [–optiona field1 field2 ... field n] [–optionb field1 field2 ... field n] [...]
• Specifying the input file(s) and columns
The –f option is used to specify the name(s) of the file(s) to plot. The x and y-axis columns are passed in as –x and –y, respectively. Therefore, the command
> ezl –f file.dat –x 2 –y 3
will plot data from the file file.dat using the file's second column for the x-axis and the file's third column for y. The default value for –x is 1 and the default value for –y is 2. Therefore, if you are plotting column 2 versus 1 you can shorten your command to
> ezl –f file.dat
Specify –x 0 to use no x-axis column from the input file. In this case, EZL will use an internal data point counter for the x-axis values, starting at 0.
The –y option will accept any number of fields, and will plot each column in the order in which they are provided. For example
> ezl –f file.dat –x 2 –y 3 6 8 4 12
will plot columns 3, 6, 8, 4, and 12 (in that order) with respect to the x-axis column, 2. And, of course, you can also provide any number of input files:
> ezl –f file1.dat file2.dat file3.dat –x 2 –y 3
> ezl –f file[1-3].dat –x 2 –y 3
These examples will plot columns 3 versus 2 for each of the three input files, file1.dat, file2.dat, and file3.dat. While both of these examples accomplish the same task, the second example uses EZL's built-in regular expressions as a way to short-cut the command. Short-cutting commands comes in handy when plotting many files on a single grid. In large batch processes, there may be cases where hundreds of files are loaded into EZL, with a command as simple as "ezl –f file*.dat".
For more details, examples, and discussions of input requirements of higher complexity, please refer to the User Manual.
• Arithmetic options
Arithmetic operations may be performed on the x and y column(s) using options –addx <value>, –subx <value>, –mulx <value>, and –divx <value> for the x-axis column, and –add <value> , –sub <value>, –mul <value>, and –div <value> for the y-axis column. For instance, to scale our above example by 2 and then add 0.5 we could issue:
> ezl –f file.dat –x 2 –y 3 –mul 2 –add 0.5
Note, to ease memorization, the –mul and –mulx options are also accepted as –mult and –multx. Additionally, the y-axis arithmetic options (–add, –sub, –mul, and –div) can be provided as –addy, –suby, –muly (or –multy), and –divy.
While pre-processing data using the arithmetic options can be omitted (plotted data can always be scaled, offset, filtered, or otherwise manipulated at any time afterwards), you can benefit from an increase in computational efficiency when using these options for plotting very large files. In general though, EZL is fast enough such that the gain is negligible between operating on your data in pre-processing or in post-processing.
• Specifying the number of values to read
Use –get <n> to specify the number of values (points) to read from your file(s). For example, the command
> ezl –f datafile.dat –get 1000000
will read 1 million points from file datafile.dat
• Specifying the number of lines (rows) to skip
Use –skip <n> to specify the number of rows to skip before reading the first value. For example, the command
> ezl –f datafile.dat –skip 100
will skip the first 100 lines of file datafile.dat before proceeding to parse the data values
• Specifying a header row
Use –header <n> to specify the row which contains column header information, should your file have one. For example, the command
> ezl –f datafile.dat –header 5
will skip the first 4 rows, will read row 5 to extract header info (x and y-column definitions), and will then parse data values from the remainder of the file, beginning at row 6.
• Combining –get, –skip, and –header
Combining –get, –skip, and –header is performed in the following order:
- –header: All rows within the file leading up to the header row are ignored. The header row is then read into EZL.
- –skip: Following the header row, the specified number of –skip rows are skipped.
- –get: Finally, the number of values specified by the –get option are then parsed in. If the –get option is not used, all values until the end-of-file are parsed.
Example:
> ezl –f datafile.dat –header 5 –skip 40 – get 10000
For this example, EZL will skip the first 4 rows before reading the header info from row 5. It will then skip the next 40 rows (rows 6 through 46) and, starting with row 47, will load 10,000 points. If less than 10,000 points remain in the file, all remaining points will be loaded. Note that this is the order of operations irrespective of the actual placement of the options within the ezl command. For example, swapping the placement of the –skip and – header options in the command above would have no effect.
• Adding new curves to existing plots
Normally the ezl command clears the current plotter before plotting new curves. You can, however, add new curves to those which already exist by using the –append option. For example:
> ezl –f file1.dat –y 2
> ezl –f file2.dat –y 3 4 –append
The first command plots column 2 of file1.dat versus the implied x-axis column 1. The second command then adds two new curves to the grid: columns 3 and 4 of file file2.dat.
• Order of options
The order of the options within the "ezl" command does not matter. So,
> ezl –f file.dat –x 2 –y 3 –mul 2 –add 0.5
> ezl –f file.dat –y 3 –x 2 –add 0.5 –mul 2
> ezl –y 3 –x 2 –add 0.5 –mul 2 –f file.dat
all result in the same plot.
The File Setup Dialog
The File Setup Dialog provides a simple way to load and configure data from data files. It is opened automatically when you: (1) Double-click on a data file within the Directory Browser; (2) Drag-and-drop one or more files from the Directory Browser to the Plotter; or (3) Drag-and-drop one or more files from your Windows filesystem, or desktop, to the Plotter. Following the drag-and-drop (or double-click) operation the File Setup Dialog will be automatically displayed.
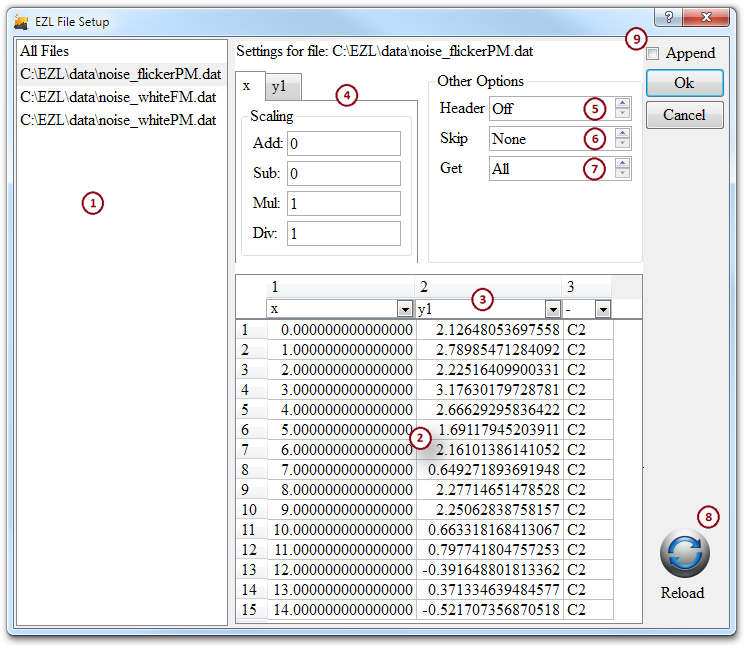
- Data file listing - The panel on the left side of the interface contains a listing of the files to be configured for plotting. The listing is automatically populated with the file(s) which were captured by the Plotter in the drag-and-drop operation, or the file which was double-clicked from within the Directory Browser. When configuring multiple files, the settings for each individual file is displayed by selecting each item within this panel. You may select the "All Files" item to modify any plot settings which are common to all of the data files. Note that when "All Files" is selected, the Preview Table is cleared, as it is not possible to simultaneously display a preview of multiple files within a common Preview Table. Nevertheless, the Column Designation drop-down boxes can still be set, and will apply to all of the files.
- Preview Table - When the dialog first opens, it automatically parses a 15-row sample from each file and places the sample into this table.
- Column Designation - Just above each column of the Preview Table is a drop-down box. These drop-down boxes are used by you to indicate the role of each column. For example, use them to choose the desired x and y data columns. You may only designate one x-column (per file). You may select as many y-columns as desired. If your file contains only a single column of data, EZL will automatically designate it as the y-column. Otherwise, by default the 1 st column is selected as x and the 2nd as y1. If you wish to have no x-axis column, change the default selection to "-".
- Scaling Factors - Scaling factors for the x and y columns may be entered into the appropriate fields of the tabbed Scaling control box. Multiplication and division always preceed addition and subtraction in the order of operations. For instance, if you have the Add, Sub, Mul, and Div fields populated with values a, s, m, and d respectively, the result is ýi=yi*m/d +a-s, where yi is the ith value from the designated y-column.
- Header - If your file contains a header row, i.e. a row with text
descriptions of each column, you may indicate it here. Enter the row number
of the header, or "Off" if no such row exists. When parsing the file, EZL will
strip away each row within the data file until the header row is reached. The
text within this row is then read and used to automatically label the plot.
Note that the text within a header row must use quotation marks if its
column-descriptions contain spaces, commas, or semicolons. For example:
# The next row is contains BAD header information...
Time (s), Temperature (C), Humidity (%RH)
1 50.15 63.99
2 42.55 60.69
3 40.05 60.33
...
# The next row is contains GOOD header information (with or without the commas)...
"Time (s)", "Temperature (C)", "Humidity (%RH)"
1 50.15 63.99
2 42.55 60.69
3 40.05 60.33
...
- Skip - Use this field to instruct EZL to ignore a certain number of rows before beginning to parse the data. If a header row exists, and is indicated in the Header field, this field indicates the number of rows to skip following the header row, otherwise, beginning with the 1st row of the file.
- Get - Use this field to limit the number of parsed rows.
Example 1: Suppose you have a million-point data file and you want to plot the data from lines 500,000 to 600,000. In this scenario you would set the Skip field to 499,999 and the Get field to 100,000.
Example 2: Suppose your file contains 10 comment lines where the 4th line is actually a header row. In this case you would set Header to Row 4 and Skip to 6 to skip the remaining unnecessary comment lines following the header row. - Reload - If you wish to preview the results of your Header, Skip, and/or Get changes, click the Reload button. EZL will then re-read the file with your settings applied. The header row will be displayed with gray text, indicating that the row is read, but not processed for data.
- Append - This checkbox is used when you wish the plot your curves without clearing any curves which may already exist. When unchecked, any curves already plotted will be deleted from the plotter when you click Ok. When this box is checked, your newly configured curves will be plotted on top of any existing curves.