
Real-time Plotting in EZL
EZL provides many ways to feed real-time data to "live" plotters. The following sections discuss the primary methods:
- Device Interface Control Panel
- Ethernet Sockets
- Serial Port Connections
- File Tracking
- Using the Web Interface Panel
- Standard Output (stdout) pipes
- Example: $ processor.exe | ezl -linked
- Custom program pipes
- For passing data and command & control of EZL
Data Format
The data passed to EZL for real-time plotting must be formatted as ASCII text. Columns must be separated using commas (CSV), spaces, semi-colons, and/or tabs. This real-time formatting is, in fact, no different than the formatting required for plotting data from files with EZL.
Binary plotting - EZL currently does not support plotting binary data. If this is important to you, please contact us at info@ezlsoftware.com
Example data:
59581.94746355, Key1, -1252391.97, 1252391.97, -1152.39, 135239.20
59581.94746471, Key2, -1242917.48, 1242917.48, -1142.92, 134291.75
59581.94746587, Key1, -1251619.26, 1251619.26, -1151.62, 135161.93
59581.94746701, Key2, -1251470.34, 1251470.34, -1151.47, 135147.03
59581.94746817, Key1, -1259477.54, 1259477.54, -1159.48, 135947.75
...
In the example data above
- Column 1 is the data's timestamp. In this example, the timestamp is provided as a Modified Julian Date (MJD). Under the scenes, EZL uses MJD for its numerical date/time representation. As such, if the x-axis column passed to EZL contains values which are within a valid MJD range, EZL will automatically format the plot's domain grid with calendar date/time labels. To turn this feature off, navigate to Toolsets→Default Settings→Auto MJD-DateTime within the Date/Time formatting section.
- Column 2 in this example provides the live plotter with a Key column. As with plotting any data in EZL (files or real-time), a Key column can be used to associate data rows with unique curves. In the example above, the 1st, 3rd, and 5th rows will be associated with a curve called "Key1", whereas the 2nd and 4th rows will be provided to a curve called "Key2". The text used for keys is not important; Apples and Oranges would have worked just as well. There is no limit to the number of keys provided.
- The remaining columns provide the data to be plotted. There is no limit to the number of columns provided to EZL for real-time plotting.
Device Interface Panel
 The Device Interface Panel is the primary method for streaming real-time data into live
plotters, where a connection to an instrument is involved. The panel provides both Serial
COM port and TCP socket connections. Of course, the panel may also be used to interface with
software which accepts socket port connections.
The Device Interface Panel is the primary method for streaming real-time data into live
plotters, where a connection to an instrument is involved. The panel provides both Serial
COM port and TCP socket connections. Of course, the panel may also be used to interface with
software which accepts socket port connections.
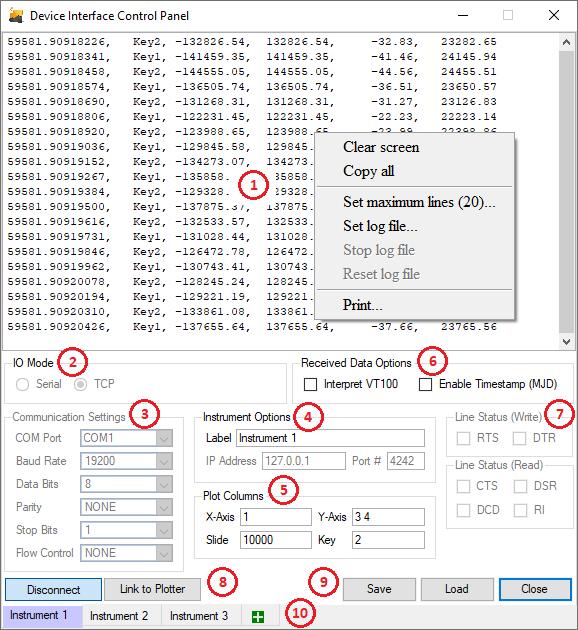
The Device Interface Panel can be broken down into the following 10 parts:
- Data Viewer - The Data Viewer window displays the data as it is streamed into EZL,
once the connection has been established. Right-clicking anywhere within the viewer provides
several options.
- Clear Screen - Clicking this simply clears the viewer.
- Copy all - Clicking this copies all of data currently in the viewer to the clipboard. The data may then be pasted into another application (eg. text file).
- Set maximum lines - This sets/limits the number of lines which will be held by the viewer. By default, the viewer is limited to 20 lines. This has no impact outside of the viewer itself.
- Set log file - This option allows you to set a log file. If a log file is set, all data received from the remote device will be streamed to the log file, in addition to the live plotter. The log file is started automatically, as soon as it is set. Note: If an existing file is chosen as the log file, all data within the file will be erased.
- Stop log file - This option halts the logger.
- Reset log file - This option clears all data from the log file and resumes logging.
- Print - This option is convenient for sending the data which is currently displayed in the viewer to a printer.
Note: After linking the connection to a live plotter (via the Link to Plotter button), the viewer will become grayed out. This helps to reduce processing in order to facilitate high-rate live plotting. All data will continue to be logged, if a log file has been set. - IO Mode - The IO modem options are used to specify whether the connection is Serial or TCP.
- Communication Settings - This block contains the options for COM (serial) settings. The settings become available when Serial is selected with the IO Mode block.
- Instrument Options - This block contains two items:
- Label - Connections may optionally contain a custom label. Setting the label renames the Device Interface Panel's page (see item 10), and the tab name of the live plotter to which it is connected. It is also helpful for organization, when multiple connections or instruments are used.
- IP Address and Port # - These options become available when TCP is selected from the IO Mode block.
- Plot Columns - This block is used to instruct EZL on how to interpret the received data.
- X-Axis - Used to set the column which should be interpreted as the independent, or abscissa, value. This field must contain one and only one column. Note: If no x-axis column is available (or desired), setting this value to 0 will instruct EZL to assign a counter to each data point plotted. I.e. Each received point will be plotted against an integer from 0 to n.
- Y-Axis - Used to set the y-axis, or ordinate, column(s). This field may contain multiple columns. Each column number must be separated by spaces.
- Slide - This field is used to set the maximum number of points which each curve on the plotter
may hold at any given time. Clearly a plot cannot contain an infinite amount of data; at some
point even the most powerful system will run out of memory. This field allows you to control
how much data the plot will contain. Once a curve has filled with the alloted number of
points, the oldest data point will fall off the plot to allow room for the newest incoming
point. For example, if your data sample rate is 1 Hz, setting this value to 86400 will ensure
that the live plotter always contains 1 day's worth of data.
It is important to recognize that there is a direct correlation between how much data a plotter is allowed to hold, and how fast it can update with each new data point. In other words, setting the slide value too large will limit the speed at which a live-plotter will function. On most systems, a slide of 10000 for plotting at a data rate of 100 Hz is not too taxing. Though, this will depend on the system. To further increase the speed limit, where high-rate plotting is required, please set the line width to 0 (command: linew 0), and disable data point markers if they are on (command: pnts off).
Note: The slide value is applied to each curve independently. For example, if the live plotter is plotting 2 columns from a data stream, and the slide value is set to 10000, each curve will slide independently at its max of 10000. So, the total number of points presented on the plot will be 20000. - Key - This field may be used to specify a Key column, which associates data rows with unique curves. A Key column is used to disambiguate rows when incoming data is interleaved. This field is optional, and may be ignored either by setting it to 0, or leaving it blank.
- Received Data Options - This block contains two general purpose options.
- Interpret VT100 - Some (typically older) instruments, control the display terminal by embedding VT100 control characters within their communication messages. Commands such as setting the background and foreground colors, cursor positions, line scrolling, screen clearing, etc, are all standard VT100 functions. EZL can accommodate such interfaces by enabling this option.
- Enable Timestamp (MJD) - This option can be very useful for plotting real-time data which contains no x-axis column. When this option is enabled, EZL will automatically insert an MJD timestamp at the beginning of each received data row. The auto-timestamp will then be available for use in the real-time plot (by setting X-Axis to 1), and will also provide timestamps to each row of the log file, when a log file has been set.
- Line Status - The Line Status blocks (Write & Read) provide control and feedback of the state of each RS232 function pin. These fields are only available for Serial connections.
- Connect and Link Buttons - These buttons connect (or disconnect) to/from the remote device, and
link (or unlink) to/from a live plotter.
- Connect to Device - Click this button to connect to the Serial device after all COM settings have been properly set, or to connect to the TCP Socket after the IP Address and Port # has been entered. After clicking, the button will change to read "Disconnect", and can then be used to break the connection. When connecting to a TCP Socket, the Data Viewer will read "TCP error: Connection refused" if a connection could not be established.
- Link to Plotter - Click this button after the connection to the device has been established, all Plot Column settings have been correctly entered, and it has been confirmed that data is streaming into the Data Viewer. Clicking this button will then link the real-time data to a live Plotter.
- Save, Load, and Close Buttons - These allow you to save all settings configured across all pages of the Device Interface Control Panel, load the setting (either through an EZL command or via the Load button), and close the panel. Note that closing the panel does NOT break an connections. Nor does it discontinue any real-time plotting, or disrupt any data logging.
- Device Interface Pages - The bottom of the panel contains a collection of tabs, providing access
to each device page. Each page configures a single device (or instrument). Additional pages may be added
by clicking the
 tab.
tab.